I've been taking photographs of a number of binocular and naked-eye variable stars for you. These are stars whose brightness changes over time. They may be a close pair of stars eclipsing each other, they may be pulsating in a regular or irregular way, they may even have star spots. I've got a varied set of variable stars for you to enjoy estimating their brightness.
Cepheids: These are extremely valuable and important and rare stars. They are very luminous, so much so they can be seen standing out amid the haze of the other billions of stars in nearby galaxies. They pulsate with a period ranging from a few days to a couple of months, and the period of the pulsation is directly tightly related to their absolute luminosity. This makes them excellent "standard candles". They are how we measure the distances to other galaxies. We have several good Cepheids to study in the Fall Sky
* Delta Cephei - the proto-type for this class, in Cepheus
* Eta Aquilae
* S Sagittae (on the same photos as those of U Delphini)
* X Sagittarrii
* W Sagittarrii (on the same photos as those for X Sagittarrii)
RV Tauri Stars - These stars go through semi-regular pulsations, alternating deep and shallow dips in brightness over a period of a month or two.
* R Scuti - The brightest of all RV Tauri stars, right under the tail feathers of Aquilae the Eagle, in the Milky Way
Semi-Regular Variables - These are old reg giants, with thin atmospheres near the ionization temperature of hydrogen, causing unstable opacity in the atmosphere, with resulting pulsations and temperature and hence luminosity changes which happen with periods from a few months to a few years.
* Mu Cephei - this is a bright star near Delta Cephei, a deep red color and known famously as "The Garnet Star". It has a strong stellar wind blowing carbon away from itself, which then cools and joins with other carbon to become graphite dust. This dust reddens the light to outside observers, making the already cool red color even redder.
* U Delphini - varies significantly over roughly a 3 month period
Eclipsing Binaries - these are pairs of stars in close orbit around each other. First one star is eclipsed and then the other. The sizes of the stars make eclipses rather different for different eclipsing binaries. Most interesting for us, is to watch a bright ellipsoidal eclipsing pair - Beta Lyrae
* Beta Lyrae - a bright naked eye star next to Vega in Lyrae, high in the sky all semester. It is two stars so close their gravity pulls them into an ellipsoidal shape, so that as they orbit they present a varying projected size onto the sky as seen by the observer. And thus, the brightness to the observer changes continuously.
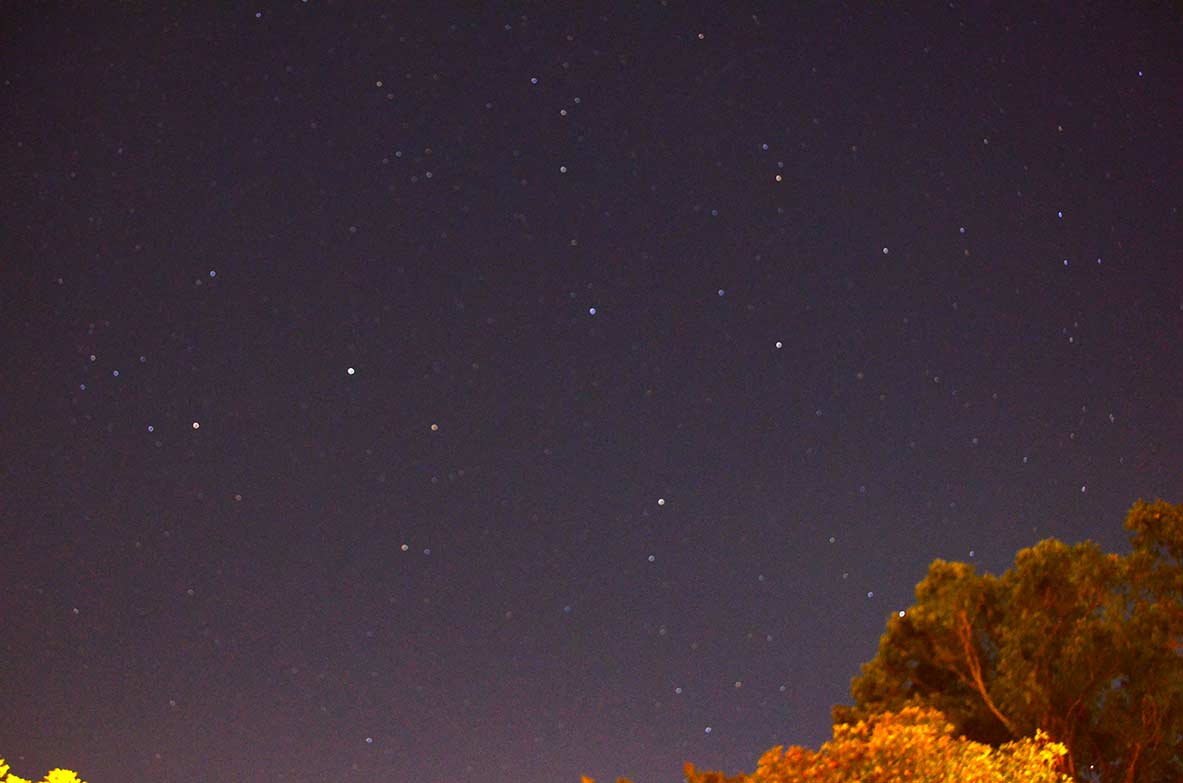
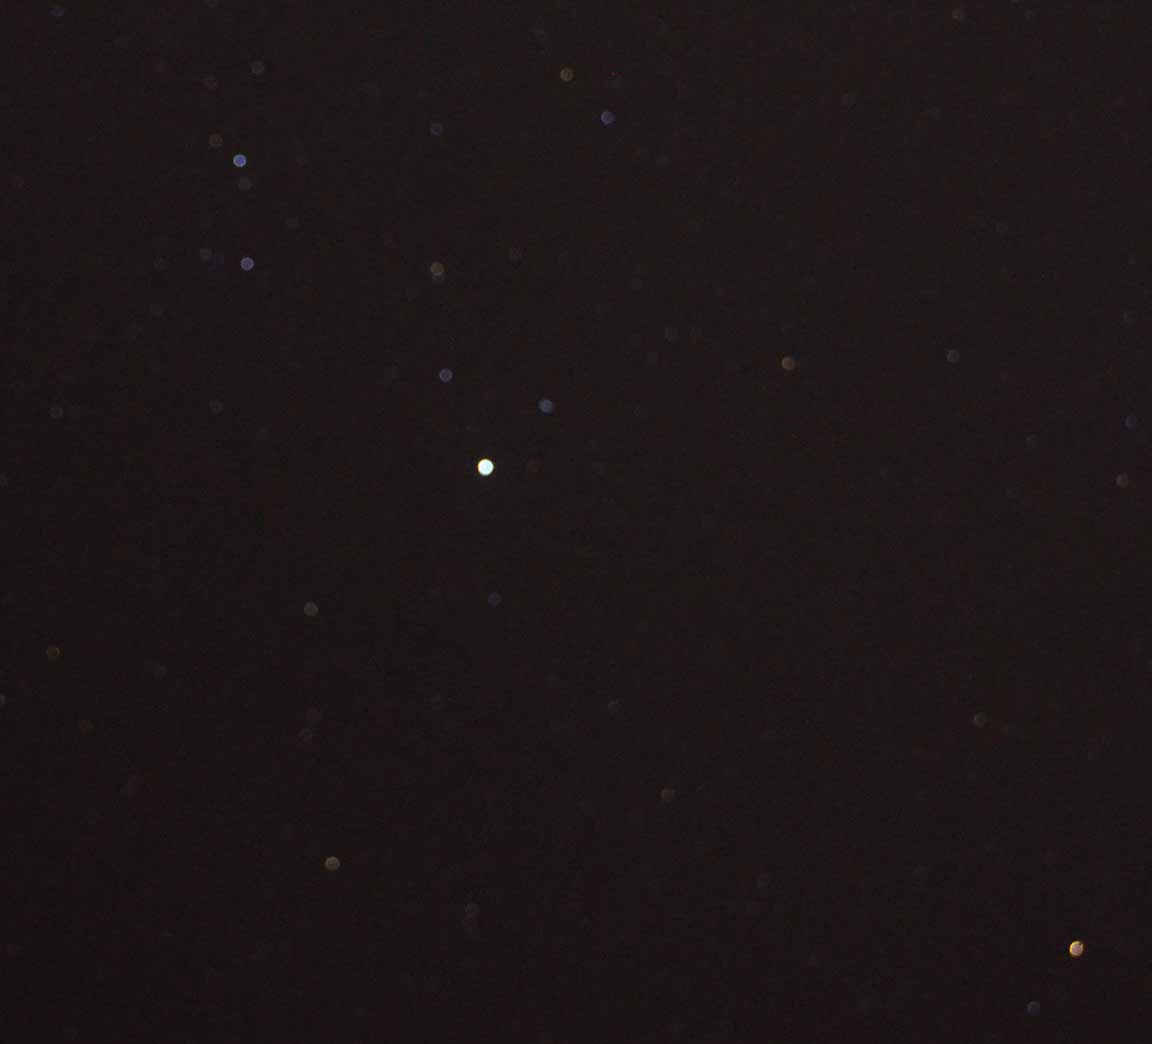
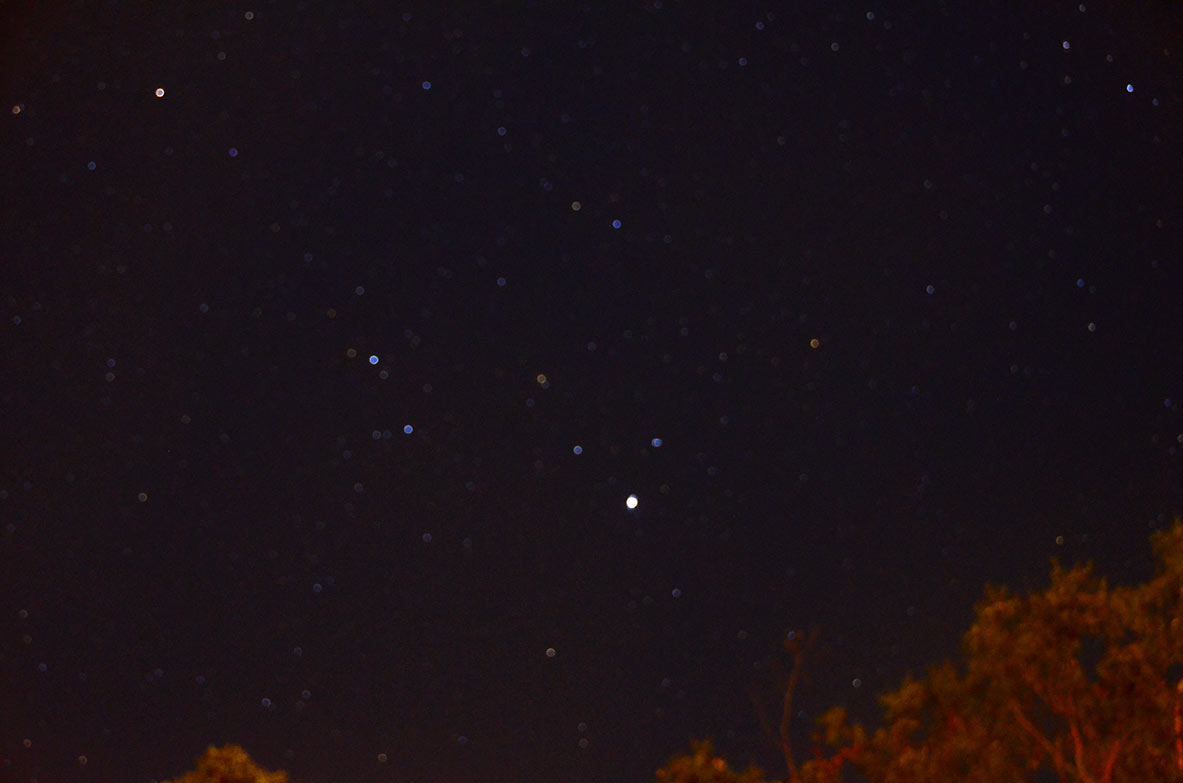
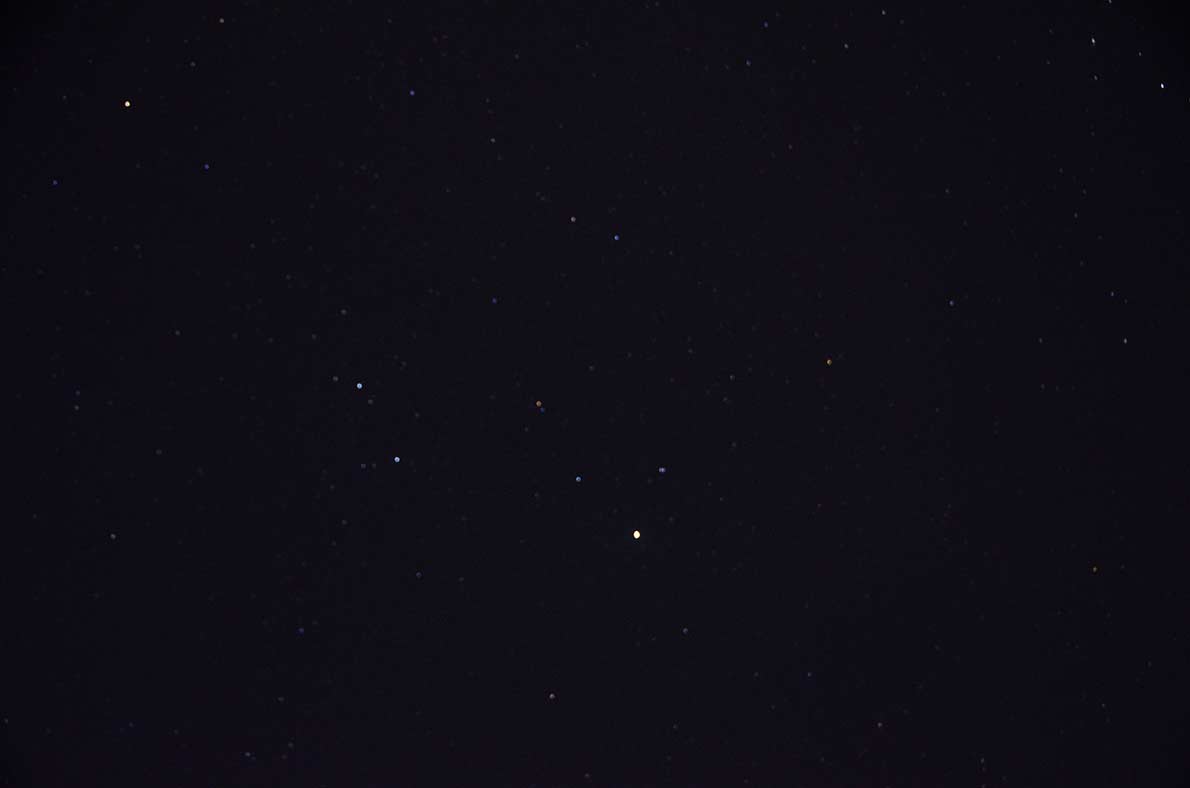
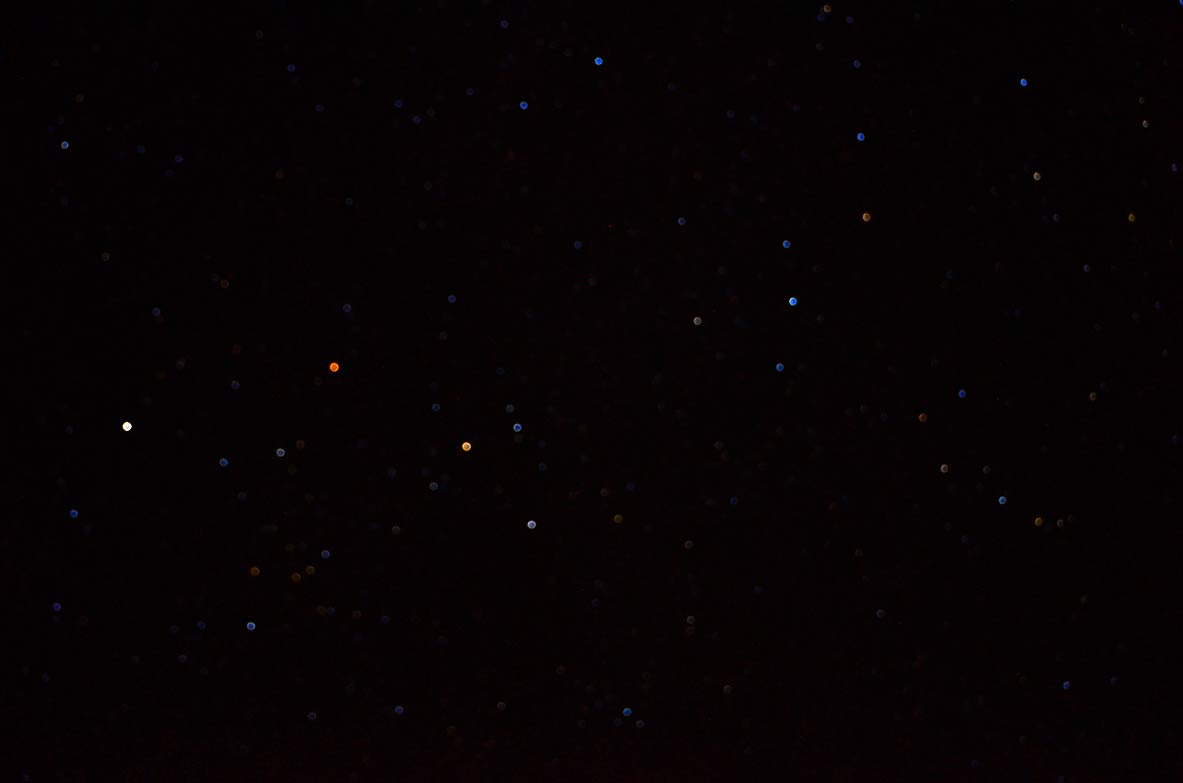
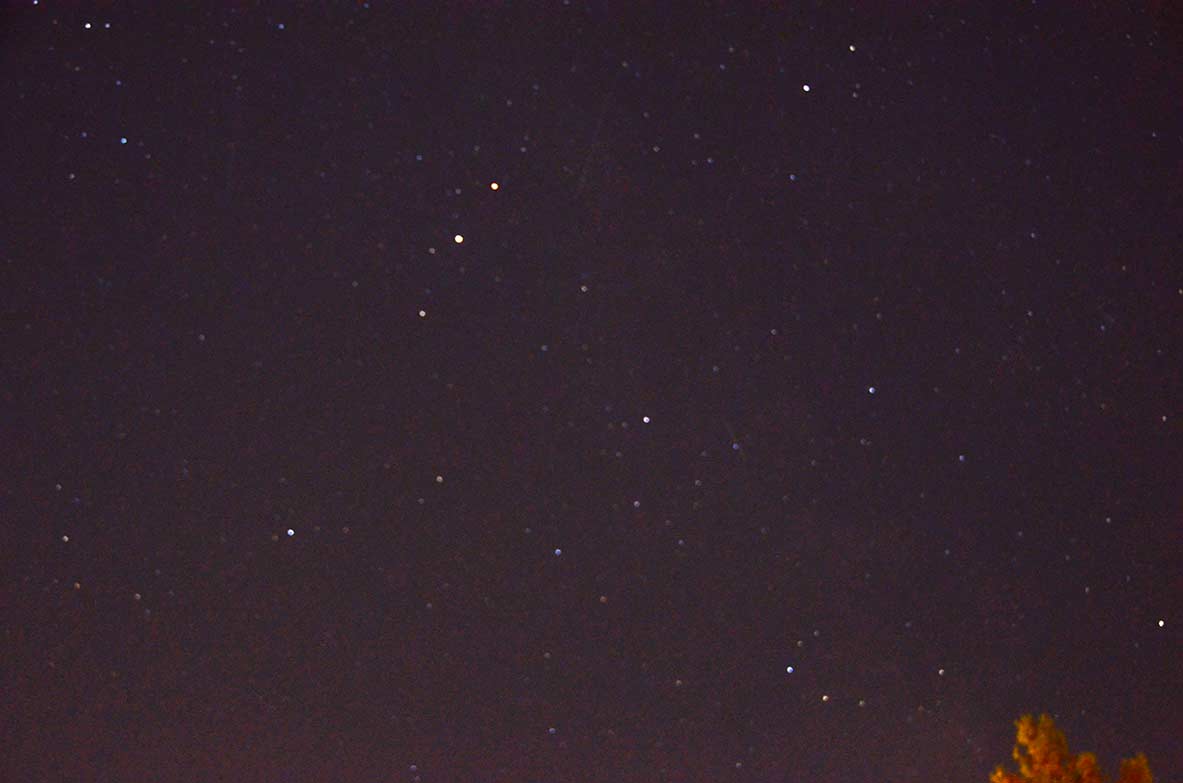
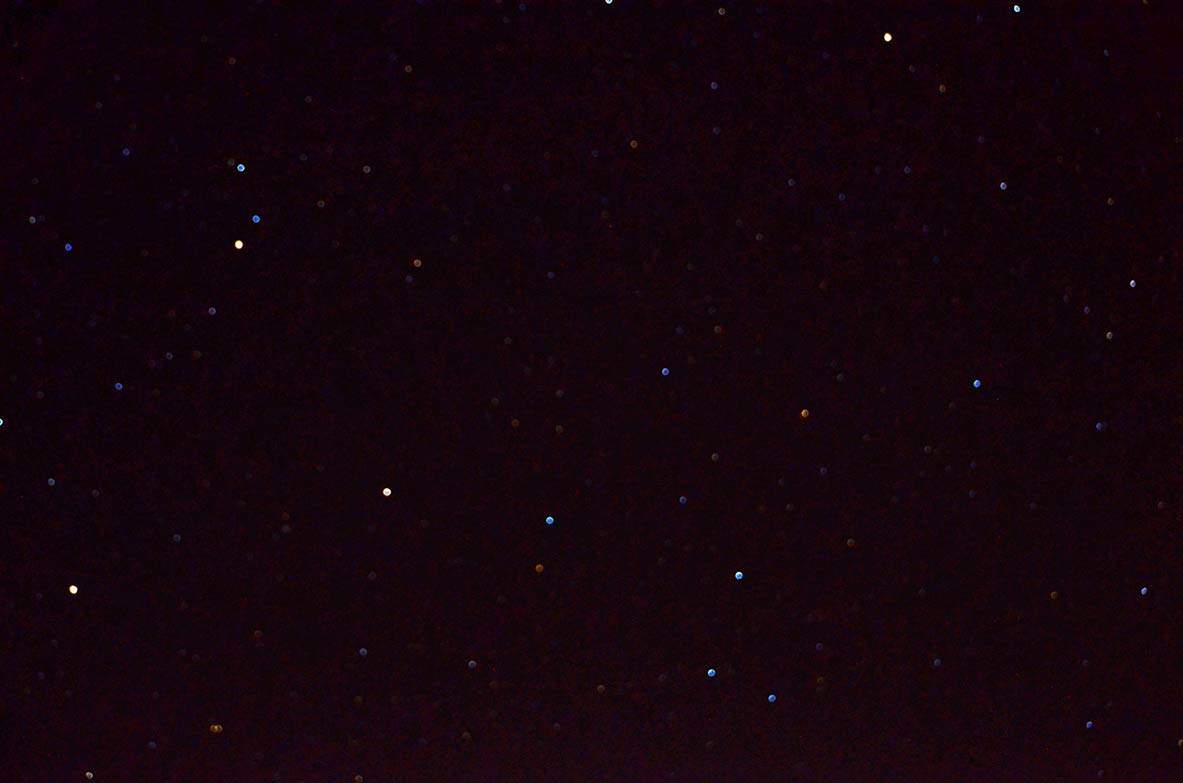
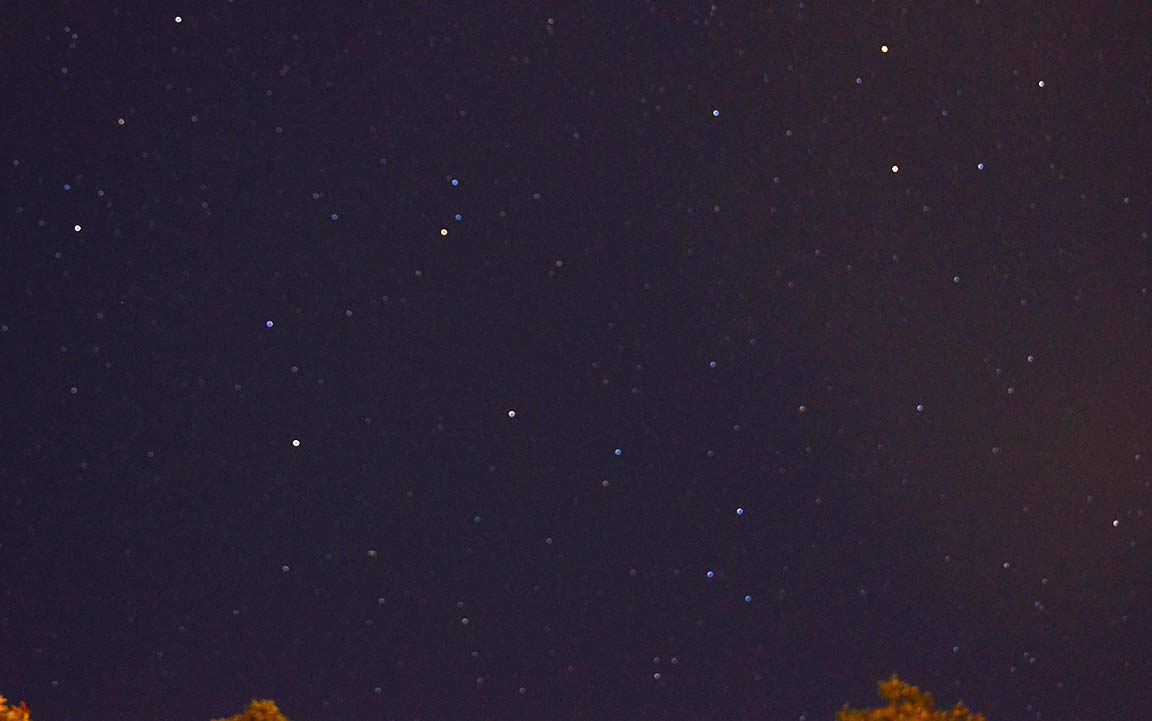
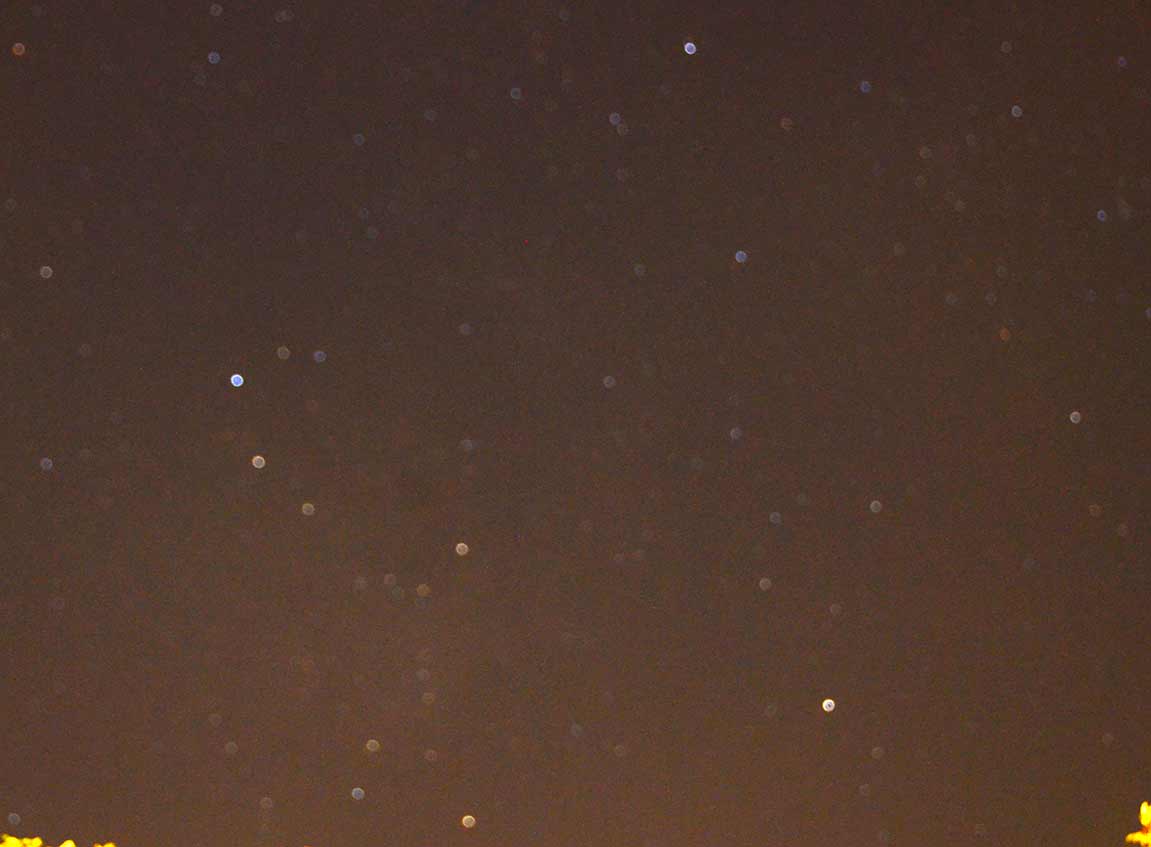
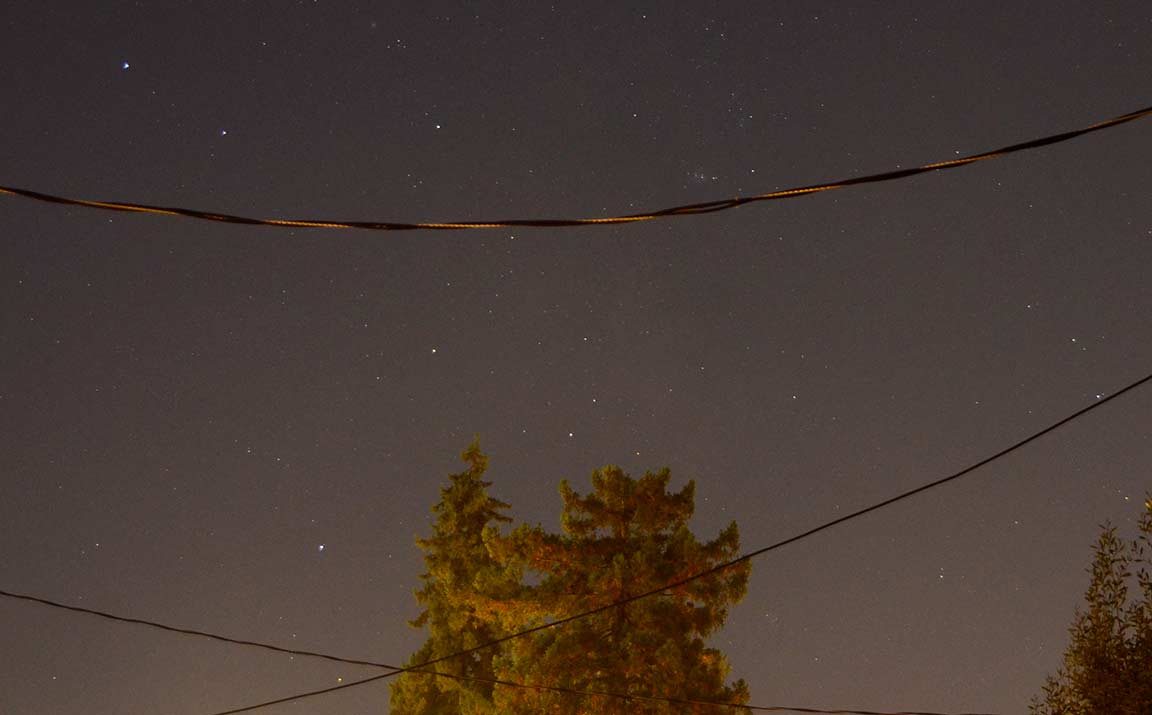
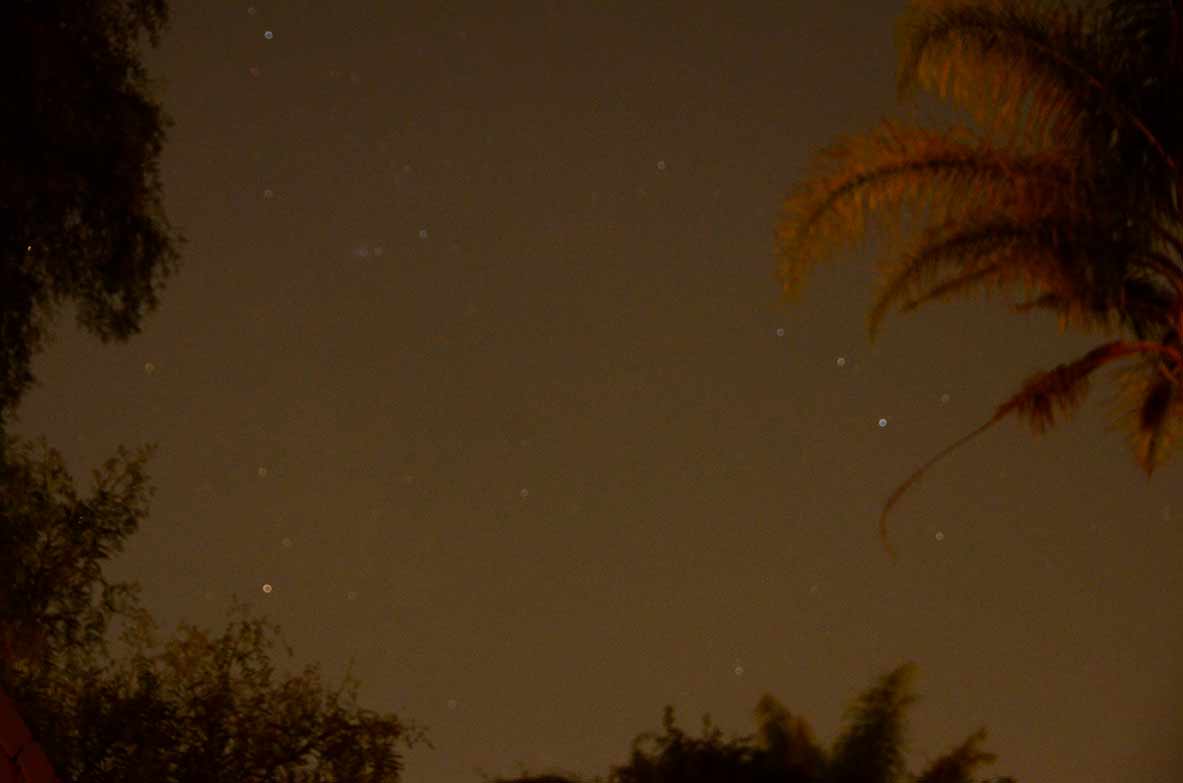
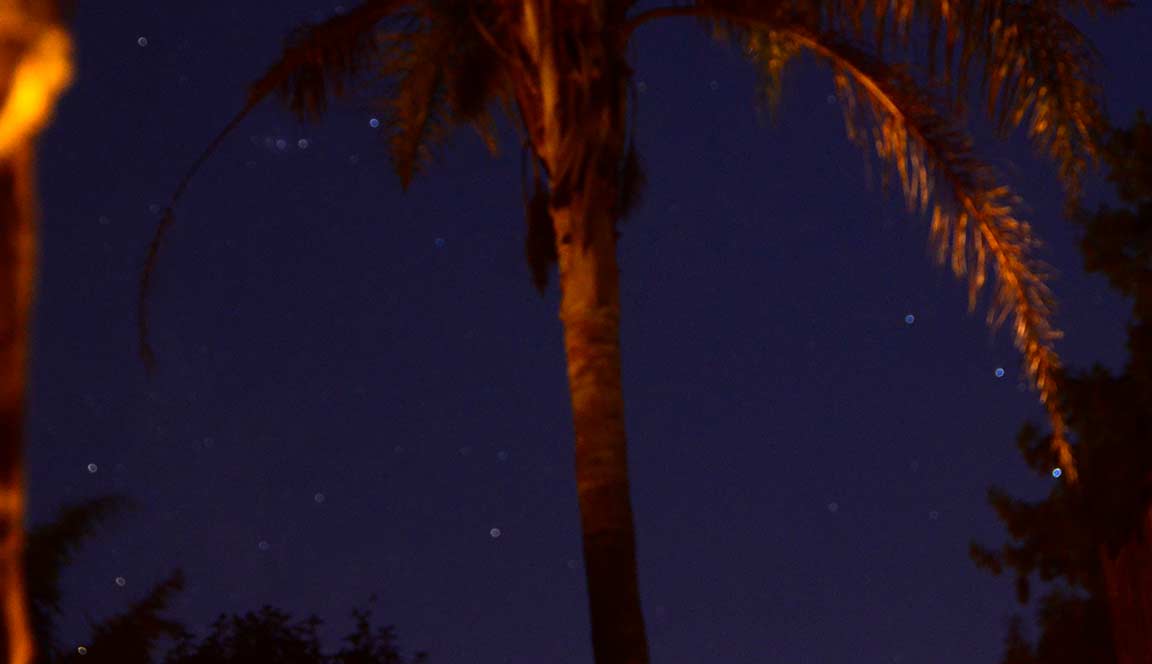
For each variable star that I will specify for you on the worksheet, look at the photos and estimate their brightness. The photos have names that are the date and fraction of a date that the photo was taken. For example 20200903-95 was taken on Sept 3, 2020 at 0.95 of the way to the end of the day (about 11pm Pacific time). You'll use that to plot the brightness on the time axis properly. The first photo in the collection is also the "finder chart", which shows where the target star is, and the magnitudes of nearby stars you should use as "comparison stars" (whose brightness is unchanging). The way you estimate magnitudes is, you let your eye play over the target and comparison stars. Find a comparison star that is brighter than the target, and one or more that is dimmer, and looking at the magnitudes I give you, use that to interpolate mentally where you think the target star's brightness is for that night. The worksheet for you to fill out for the periodic variable stars is here.
I like RapidTables for doing "scatter plots" such as we're doing. My only gripes are that it won't plot magnitudes with lower (brighter) numbers going up on the y axis. And, entering the data is a little awkward. Better if they could import a .txt file you make. But you can easily save your data in a text file and then copy/paste it into the box in RapidTables and get your plot easily without re-typing everything in. it will work if I can't find something better. I did give the authors feedback to please let the user select the direction of the axes to be either direction. We'll see if they make that fix.
The final output will be a graph you email to me that looks something like this. Note the title (I want your name included), and that we'll use Julian Date's for our time axis for most variable stars. There'll be a separate lab for also doing the Cepheids and eclipsing binaries into a "folded" plot. We do that at the end of the semester, the very last lab.
Here's the Steps For You To Follow
* Click on the finder chart image next to the star name below. Note your comparison stars and your target variable(s) (some have two good variable stars in the same field of view). Then go through each successive image and estimate the brightness "by eye" of your variables by using those comparison stars. I strongly suggest using the CNTRL+ keys to magnify the image as much as possible and still keep your target and comparison in view. The more blurred the images the easier to estimate accurately (Unfortunately, I just did the set on Alpha Herculis and Beta Lyra myself, and realize I need to be more aggressive about making sure the photos are WAY out of focus. But, the photos are still usable as is).
* Find two stars, one of which is slightly brighter and the other which is slightly fainter, and estimate the brightness of the variable: If it looks 60% of the way from the dimmer to the brighter comparison, then the magnitude is 60% of the way between those two stars. If only 20% of the way, then 20% of the way in magnitude number too. Etc.
* Your light curve graph will be a set of x,y pairs. The X axis will be "Julian Date", and the Y axis will be "Magnitude". You've now got the magnitude ( Y value) for one of your photos. So now we need to get the X value = the time of the observation in usable form.
* The time the photo was taken is given as the file name itself. Here's how to get the proper digital time from this file name... best to learn by example:
file name 20200814-98 means year 2020 on Aug 14 and .98 or 98% of the way through that day. So, 98% of 24 hrs is 23.52 hours, or 11:32pm (=0.98 x 24 and converted to usual clock time). Now take that time and ADD 8 hrs to it in order to get Universal Time. That'll usually put it into the morning of the following day, as seen in London, England (where Universal Time is based).
*You need to convert this to Julian Date (JD) , which is the way astronomers get rid of these awkward weird inconsistent time units of every day life.
* Convert here: Julian Day website link and enter the month, day, year, hours and minutes (ignore the seconds) and click "calculate" and get the Julian Date value of the observation. Now, there's a lot of digits there because JD=0 goes back to the beginning of Civilization! We don't need that many digits, so just write down the 3 digits to the left of the decimal and then all to the right of the decimal, so for example JD= 24559100.8323 you'd write down as just 100.8323 as the trimmed JD.
* You'll want to make a text file for each of the variable star names below. I like NotePad for doing this. Open in Windows "Notepad" a file and just enter a single line with alternating time and magnitude. So it would look like x1 y1 x2 y2 x3 y3 etc, without any commas and exactly 1 single space between each of the numbers. This is the format that RapidTables needs. Save that file in a convenient place and name it to correspond to our variable stars, like JohnDoe-R-Scuti.txt for example. Now, when you are ready to plot an updated version as you get more photos to examine, you just open your NotePad file, add the new (JD mag) pair to the end, then (in Windows) right-click "copy" that single line with all the magnitudes and times, and then "paste" into the RapidTables box for the first data (RapidTables lets you plot up to 4 sets of data per graph. You don't want to do that. Just one set of data, so use the top line to paste in your time and mag pairs.)
* Add your labels, which should look, for example, like this.
* Then click "Draw" and it'll plot your data.
* For the periodic variable stars: the Cepheids and Beta Lyrae, we're going to do an extra step on the last day of the course, the Final Exam date. It's very simple to do. Since these stars follow the exact same magnitude pattern in every cycle, we can "fold" the points onto a single period and get an even better light curve. I'm making a separate lab sheet for each of these stars so you can then plot magnitude vs. phase. The magnitude vs phase worksheet is here. We'll plan to do these phase plots on the last day of the semester, in the classroom.
* Then... save your plot as a .png image. and print it so you can bring it to class. If you can't print it, let me know. Before printing, make sure it looks reasonable. Remember that in this graph, brighter will be lower magnitude and is therefore here going to be plotted "upside down"... not what I'd prefer, but hey - It's just what this freeware does!
There are 3 "deliverables"....
(1)
the worksheet linked above, with your magnitude estimates with the trimmed JD's and phases.
(2) The text file you'll make with your phases and magnitudes paired as described, all on a single line. Submit in Canvas
(3) The image file you'll make in RapidTables showing your light curve. Print and bring to class.
Note that I've linked here for my own convenience, the photo images I've made for ALL stars I've photographed.
You follow your individual assignment sheet and just do the ones I ask of you. So, most of the stars below you will not be doing...
Alpha Herculis - finder chart
2020 08 14.99
2020 09 03.92
2020 09 04.92
2020 09 06.88
2020 09 07.88
2020 09 16.86
2020 09 18.85
2020 09 22.91
2020 09 23.84
2020 09 24.92
2020 09 25.93
2020 10 04.84
2020 10 09.84
Beta Lyrae and R Lyrae - finder chart
2020 08 14.96
2020 09 02.90
2020 09 03.92
2020 09 04.92
2020 09 05.87
2020 09 06.87
2020 09 07.88
2020 09 16.86
2020 09 18.85
2020 09 22.90
2020 09 23.92
2020 09 24.98
2020 09 25.92
2020 09 30.84
2020 10 03.83
2020 10 04.84
2020 10 09.84
2020 10 15.02
2020 10 22.81
2020 11 14.80
2020 11 25.79
Delta Cephei and Mu Cephei - finder chart
2020 08 14.98
2020 09 02.98
2020 09 03.95
2020 09 04.92
2020 09 05.87
2020 09 06.87
2020 09 07.87
2020 09 18.84
2020 09 22.92
2020 09 23.84
2020 09 24.92
2020 09 25.93
2020 09 30.88
2020 10 03.84
2020 10 04.83
2020 10 09.85
Eta Aquilae - finder chart
2020 08 12.99
2020 08 14.96
2020 09 02.90
2020 09 04.04
2020 09 05.86
2020 09 06.86
2020 09 07.87
2020 09 16.84
2020 09 18.83
2020 09 22.88
2020 09 23.84
2020 09 24.91
2020 09 25.92
2020 09 27.82
2020 09 30.84
2020 10 03.84
2020 10 04.84
2020 10 09.83
g Herculis - finder chart
2020 08 12.98
2020 08 14.98
2020 09 02.91
2020 09 04.92
2020 09 05.87
2020 09 06.87
2020 09 07.87
2020 09 16.86
2020 09 18.94
2020 09 22.91
2020 09 23.84
2020 09 24.92
2020 09 25.92
2020 09 30.88
2020 10 04.83
2020 10 09.84
R Scuti - finder chart
2020 08 13.00
2020 09 02.90
2020 09 04.82
2020 09 05.86
2020 09 06.86
2020 09 07.89
2020 09 16.85
2020 09 18.94
2020 09 22.88
2020 09 23.84
2020 09 24.88
2020 09 25.93
2020 09 30.88
2020 10 03.83
2020 10 09.84
U Delphini and S Sagittae - finder chart
2020 08 13.05
2020 08 14.95
2020 09 03.92
2020 09 04.82
2020 09 05.87
2020 09 06.87
2020 09 07.87
2020 09 16.88
2020 09 18.83
2020 09 22.88
2020 09 23.83
2020 09 23.84
2020 09 24.92
2020 09 25.93
2020 09 30.87
2020 10 03.83
2020 10 04.82
2020 10 09.83
X Sagittarii and W Sagittarii - finder chart
2020 08 13.03
2020 08 14.95
2020 09 03.91
2020 09 04.93
2020 09 05.86
2020 09 06.86
2020 09 07.86
2020 09 16.84
2020 09 18.83
2020 09 22.84
2020 09 23.83
2020 09 25.92
2020 09 27.82
2020 09 30.82
2020 09 30.88
2020 09 30.89
2020 10 03.81
2020 10 04.82
2020 10 09.83
2020 10 09.84