Summary of Key Evidence that Current
Global Warming is Human-Caused
Here I review the key evidence that observed global warming is greenhouse warming. And I'll show there is no uncertainty in the origin of the greenhouse gases: rising CO2 is from fossil fuel burning and secondarily from the oxidation of methane mostly (so far) by our livestock, and the forests we're cutting down. Water vapor rising due to simple physics of the saturation point of atmospheric water vapor vs temperature, and the greenhouse properties of water vapor. Methane and CO2 is human-generated, verified by the known quantities of livestock and burning rates of fossil fuels, and observed atmospheric carbon isotope ratio changes.
First I remind you that several studies show that ~100%
of active climate scientists in 2014 are convinced that we, human beings, are responsible
for most or all of current global warming. What is the convincing evidence?
Below was taken from the 2007
IPCC Working Group 1 (Scientific Basis for Climate Change) section
on the robust (i.e. with high confidence) findings from the science...(this, from the over-cautious and politically obstructed IPCC).
Notice how rapidly the CO2 emission rates are accelerating. These
are extremely rapid on a geologic timescale, far faster
than the ocean can pull CO2 back out of the atmosphere, faster than
the slow oscillations in CO2 into/out of the atmosphere seen in the
paleoclimate record.
* Current atmospheric concentrations of CO2 and CH4, and their associated
positive radiative forcing, far exceed those determined from ice core measurements
spanning the last 650,000 years. {6.4} Fossil fuel use, agriculture and
land use have been the dominant cause of increases in greenhouse gases over
the last 250 years. {2.3, 7.3, 7.4}
* Annual emissions of CO2 from fossil fuel burning, cement production and
gas flaring increased from a mean of 6.4 ± 0.4 GtC yr–1 in
the 1990s to 7.2 ± 0.3 GtC yr–1 for 2000 to 2005. {7.3}
* The sustained rate of increase in radiative forcing from CO2, CH4 and
N2O over the past 40 years is larger than at any time during at least the
past 2000 years. {6.4}. Natural processes of CO2 uptake by the oceans and
terrestrial biosphere remove about 50 to 60% of anthropogenic emissions
(i.e., fossil CO2 emissions and land use change flux). Uptake by the oceans
and the terrestrial biosphere are similar in magnitude over recent decades
but that by the terrestrial biosphere is more variable. {7.3}
* It is virtually certain that anthropogenic aerosols produce a net negative
radiative forcing (cooling influence) with a greater magnitude in the
NH (northern hemisphere) than in the SH (southern hemisphere). {2.9, 9.2}. From new estimates of the combined anthropogenic
forcing due to greenhouse gases, aerosols and land surface changes, it
is extremely likely that human activities have exerted a substantial net
warming influence on climate since 1750 {2.9.} Solar irradiance contributions
to global average radiative forcing are considerably smaller than the
contribution of increases in greenhouse gases over the industrial period
{2.5, 2.7}(RN:
Think what this last means - it means that global temperatures have been
rising sharply despite the pollution (aerosols) which we've put into the air and which
are having a net cooling effect during the post-industrial period. Something
else is driving climate much more strongly than any aerosol driven cooling, clearly.
That's anthropogenic CO2, up 40%, methane, which has doubled, and water vapor from higher evaporation from warmer oceans and retained in a hotter atmosphere.) |
* We See A Warming Troposphere
Plus A Cooling Stratosphere: A Signature Unique to Greenhouse-Caused Global
Warming.
Greenhouse gas-induced warming is the only known
mechanism which can explain how the troposphere (lower atmosphere) is observed
to be warming while the stratosphere (next layer above the troposphere) is observed to be cooling.
The mechanism is this - outgoing infrared radiation from the ground is absorbed by the higher GHG's in the lower atmosphere, and this is absorbed and backscattered to enhance heating of the ground and the atmosphere - the Greenhouse Effect. Until radiative equilibrium is reached (which takes decades after the end of fossil fuel burning) there is therefore less of this outgoing infrared which reaches the stratosphere to warm it. At the same time, CO2 molecules are being added at all levels of the atmosphere because CO2 diffuses throughout the atmosphere very rapidly. Now, molecules, and particularly CO2, can absorb energy not only by radiation (infrared) but also by collisions with other particles. These excited CO2 molecules then, as we discussed in class, de-excite by giving off light (infrared) and this infrared escapes, thus cooling the stratosphere. To say it more briefly, higher CO2 levels in the stratosphere inhance cooling by infrared radiation from excited CO2 molecules, while heating is diminished because less infrared from below makes it up to the stratosphere, and so the net effect of CO2 in the stratosphere is cooling. See a longer explanation (but perhaps not as easy to follow)
here. This is indeed the pattern which the real-world
observations show (Fu
et al. (2004), Randel
et al. (2009) and many other journal published studies linked here).
No contending global warming hypothesis has been proposed by AGW denialists which even remotely
matches the observations. Note in particular that solar insolation increases
would cause warming in both troposphere and stratosphere. Ozone is also a greenhouse
gas and its loss in the '75-'93 period did contribute to stratosphere cooling,
but only about equal to the cooling caused by CO2, and since '93 when ozone began to rebuild, that trend
should have reversed, which indeed the observations show it has (Ajavon
et al. 2007) (See
here for good explanations and links to published studies on Greenhouse
gas effects, including the troposphere/stratosphere issue.

Climate modelling of the
atmospheric temperature evolution from 1861 to 2005 vs. altitude. Note
the rising temperatures in the lower atmosphere together with cooling
temperatures in the stratosphere. Stratospheric cooling later in the 20th
century had a significant contribution from decreasing ozone, which
absorbs solar UV. However, with the banning of ozone-destroying man-made
refrigerants (CFC's), ozone has begun a slow recovery, while stratospheric
cooling due solely to other GHGs (mainly CO2), continue. From Schwartzkopf
and Ramaswamy (2008)
|
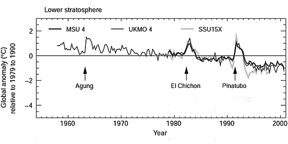
Observed cooling of the stratosphere; data from three different satellites using slightly different technologies. All give consistent results. Note that injections of aerosols by powerful volcanic eruptions provides dark particles which absorb sunlight and temporarily heat the stratosphere, (while at the same time shielding the lower atmosphere and thus cooling it).
|
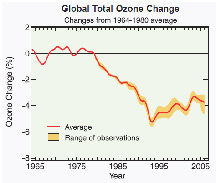
Global total ozone (O3).
CFC's, increasingly used post-WWII, eventually migrated to the stratosphere
and destroyed O3 beginning about 1975, until banned in the early '90's when
a slow healing began. O3 levels are not expected to recover
fully until about the year 2060. Recovering O3 levels provide heating, yet the cooling effect of CO2 has cancelled this out, as seen from the previous graph.
While total global stratospheric ozone is rising thanks to the CFC ban, Arctic ozone is on the decline. See link below on this page.
|
* Nighttime Temperatures are Rising Faster than are Daytime Temperatures

Global surface temperatures: daily maximum, minimum, and difference, from IPCC AR4.
|
Increasing greenhouse gases would (other things being equal) cause a decrease in the daily temperature range (DTR), which has been observed (Braganza 2004, Alexander 2006). Why? Because temperatures reflect the integrated heating that has already happened during the day, so that peak temperatures occur in the late afternoon, not at noon as you'd naively expect if there were no lag. The hot ground can't efficiently radiate away this heat because it is trapped by CO2, and this keeps night-time temperatures warmer. Daytime temperatures are warmer too, but not as much because it is not increased incoming sunlight that is causing Global Warming, it is human-caused Greenhouse gases inhibiting re-radiated cooling, which happens later, AFTER the incoming solar heating. A demonstration of this can be seen in the mid/late 20th century data, when cooling by human-caused aerosol pollution subtracted from greenhouse warming causing daytime temperatures to stay roughly constant, while nighttime temperature increased (Wild, Ohmura, and Makowski 2007).

Berkeley Earth Surface Temperature group's DTR curve. I've not yet found a good discussion as to why this differs from the IPCC DTR curve at left, since the Berkeley global avg temperatures for the 20th century agree very well with those from the IPCC data. |
Nevertheless, decreasing DTR should be considered relatively weak evidence for greenhouse warming. First, regional DTR's (vs. global) over the ~60 year interval can vary significantly. Europe, in fact, showed an increasing DTR, not decreasing. Cloud cover changes and human-caused aerosol changes can have a significant effect on DTR as well. Aerosols can cool day time temperatures while inhibiting outgoing IR at night. Soil moisture is also an important factor, as a coolant while evaporating, and also as adding heat capacitance while warming. While the evidence for cloud cover showing a trend with global temperatures is still weak, we would expect strongly regional changes in precipitation, and clearly also in aerosols, as the U.S. has cleaned its air while China and Asia in general are going in the opposite direction. Finally, decreasing DTR is a second order effect - it is the difference between two rising temperatures (night and day) and the two rising temperatures themselves are only about 1 degree C so far, and therefore has more numerical uncertainty. Finally, the Berkeley Earth Surface Temperature group's study finds that DTR fell for most of the 20th century, but has been rising slightly for the past ~25 years, when the IPCC 2007 graph at left shows a levelling off. 70% of the Earth is covered by oceans, and the fact that air temperatures above the ocean are not included may be relevant. .
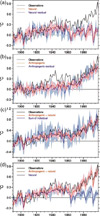
* Climate Models Can Closely Reproduce Temperatures
Over the Past Century, but Only When Human Causes are Included
"By far the largest temperature response is to the GHG's in Fig.
1e, with slow warming occurring in the first half of the twentieth century up
to about 0.1C in the1940s, but then accelerating after about 1970 to values
of around 0.88C at the end of the century. "It is clear that the only forcing
that approximates the large observed late-century warming is the response to
anthropogenic GHG's" - from the conclusion section of Meehl
et al. (2004)

Meehl
et al. (2004) FIG. 1.
(a) The four-member ensemble mean (red line) and ensemble member range
(pink shading) for globally averaged surface air temperature anomalies
(8C; anomalies are formed by subtracting the 1890–1919 mean for
each run from its time series of annual values) for volcanic forcing;
the solid blue line is the ensemble mean and the light blue shading
is the ensemble range for globally averaged temperature response to
volcanic forcing calculated as a residual [(volcano+solar)-solar];
the black line is the observations after Folland et al. (2001); (b)
same as (a) except for solar forcing, and a solar residual [(solar
+GHG+sulfate+ozone)-(GHG+sulfate)-ozone)]; (c) same as (a) except for
sulfate forcing, and sulfate residual [(GHG+sulfate)-ozone)-(GHG+ozone)];
(d) same as (a) except for ozone forcing, and ozone residual [(GHG+sulfate+ozone)-(GHG+sulfate)];
(e) same as (a) except for GHG forcing and GHG residual [(GHG+sulfate)]-sulfate
|
Meehl
et al. (2004) FIG. 2 (a) As in Fig.
1a except for natural forcings (volcano+ solar) and response
to natural forcings as a residual [(volcano+solar+GHG+sulfate+ozone)-(GHG
+sulfate+ozone)]; (b) same as (a) except for anthropogenic
forcings (GHG+sulfate+ozone) and response to anthropogenic
forcings as a residual [(volcano+solar+GHG+sulfate+ozone)-(volcano+solar)];
(c) same as (a) except for sum of individual single forcings
[(volcano)+(solar)+(GHG)+(sulfate)+(ozone)] and simulation
including all forcings [(volcano+solar+GHG +sulfate+ozone)];
(d) same as (a)except for simulation including all forcings
[(volcano+solar +GHG+ sulfate+ozone)] compared to natural
forcings [(volcano+solar)].
|
* When Fit to Observational
Data, Rising Man-made Greenhouse Gas Levels Account for
~ALL of Recent Global Warming When Human-Caused Aerosol Cooling is Included (Hansen 2007).
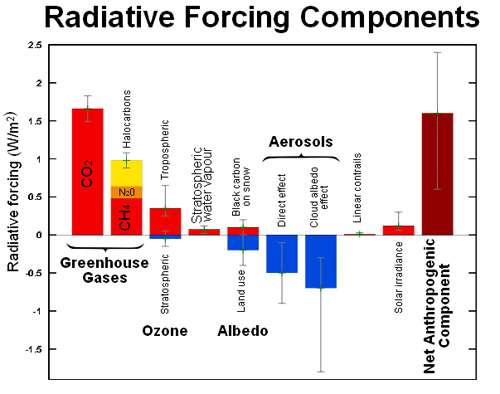
Anthropogenic radiative forcings from the different components, IPCC as of 2005. Since then, GHG forcings have increased, of course. Note that methane (CH4) contributes about 1/3 that of CO2. This may increase significantly in the near future. See below. |
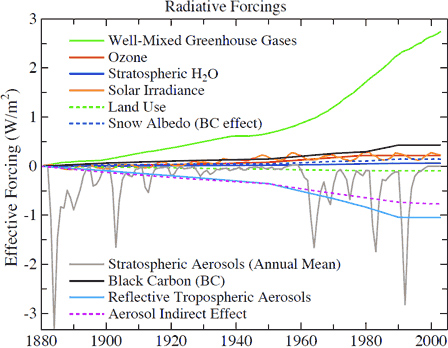
Note the green curve, which
is the well-mixed greenhouse gases (mainly CO2, but some from methane,
NO2, and others). They are by far the largest forcing, the forcing is positive,
and it has been rising most steeply since ~1960. From Hanson (2005).
|
*Ten Different Climate Measures Show Unique Agreement with Human-Generated Greenhouse Gases
This link gives references to climate science journal papers showing the "human fingerprint" on climate change as revealed by a number of data; surface temperature change, increasing night-time temperatures, stratospheric cooling, rising troposphere/stratosphere boundary height, cooling atmosphere above the stratosphere, ocean temperature profiles, surface atmospheric pressure changes, changing precipitation patterns, increasing IR downward from the atmosphere and decreasing IR upward to space, and increasing energy imbalance at the top of the atmosphere, industry records showing rate of fossil fuel burning.... These measures agree well with predictions of anthropogenic CO2-induced global warming not just in direction but in amount, and together provide an strong conviction that humans are the cause.
Finally, we know the rapidly rising carbon in the atmosphere is human-generated from the C13/C12 ratios in the atmosphere vs. in ancient coal and oil.

Plants (hence, fossil fuels) preferrentially take up carbon-12. As fossil fuel generated CO2 rises since the dawn of the industrial age, carbon-13 thus is expected to make up a smaller fraction of total carbon. From known emission levels, we can predict the ratios, and the observations shown above are just what models predict. Note too the much more rapid drop in C-13 after 1950 (see at right), with post-WWII rebuilding. The conclusion is inescapable - the rapidly rising CO2 we see is human-caused, mainly by fossil fuel burning. (From Francey et al. 1999) |
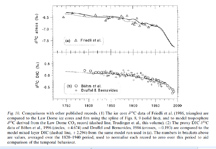
Carbon 13 fraction in the atmosphere for the Industrial Age, from Francey et al. 1999. Note the rapidly accelerating drop after World War II, corresponding to the rapid rise in the main atmospheric carbon isotope - carbon 12, caused by human burning of fossil fuels. |
* I can't emphasize this enough - AGW denialists
not only need to come up with another explanation for global warming (they haven't),
they also need to come up with magic physics which will nullify a hundred
years of solid atomic physics demonstrating the CO2-induced greenhouse
effect, and straightforward calculations of the magnitude of the effect given
the 100% certain levels of CO2 observed, and which are already proven by isotopic ratio analysis to be generated by fossil fuel burning.
Good Visual Summary
of the Evidence that Global Warming is Happening, and Caused by Man
American
Institute of Physics publication on the history of the science of CO2 and climate
Return to Climate home page


