Hayabusa Photometry - Comparison with Modelling. Notes
Capsule dimensions: 40cm in diameter, 25cm "deep", mass= m(H) = 18kg. Source:http://reentry.arc.nasa.gov/conditionshayabusa.html
Velocity of re-entry = 12.2km/sec. Source: http://www.jaxa.jp/article/special/hayabusareturn/kawaguchi01_e.html but this differs from the final TCM4 path. See below... I use the final TCM4 path velocities.
Using Albers' TCM4 path sent in June '10, I constructed the absolute UT and the velocity for each point. Here is the .txt version of this TCM4 Path Note the velocity at first increases, presumably because of acceleration due to Earth's gravity. Maximum velocity is 11.57 km/sec at 83 km altitude, a few seconds after predicted first appearance at 93 km altitude. Then velocity rapidly decreases as deceleration goes into heating.
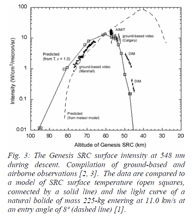
Jenniskens etal Figure 3. The predicted light intensity expressed as a surface luminosity per steradian, for the Genesis re-entry. We use the estimated slope and first point, at 96 km altitude, to estimate the luminosity for Hayabusa at an effective altitude of 101 km, in the Word document linked at bottom
|
|
|
|
|
Jenniskens etal. describe the source of Fig 3.... "These broadband observations were calibrated by comparing to similar images of Venus and Betelgeuse, from which the observed flux was derived measured at the entry aperture of the camera. This flux was then translated into an intensity at the source at 584 nm (peak of the Visible photometric band) by dividing by the solid angle subtended by the SRC at each time (= projected front surface area / distance^2, in units of steradian). This result differs from that reported in [2] by a factor of 4π. The result was plotted versus the altitude of the SRC as given by the final entry trajectory (Entry - 8 hr) issued by the Genesis mission [1].
The results are compared to the predicted surface-averaged intensity, derived from the calculated distribution of surface temperatures, assuming an emissivity of ε = 1.0 for lack of a better-known value (open squares in Fig. 3)"
Genesis was 1.52m in diameter, and entered at 11 km/sec at 135km alt. Looks like from Fig 3 that m(Genesis) = 225 kg . KE = 1/2 m v**2 so...
Haybusa KE = Genesis KE x [m(H)/m(G)] x (11.54km/sec/11.0 km/sec)**2 = Genesis KE x (18/225) x (11.54/11)**2 = 0.0874 = 8.7% of Genesis.
The other factor is the steradians of the fireball. Use Gemini Observatory's convenient converter from magnitudes to intensity, and then find solid angle covered by the heat shield, assuming similar profile to that for Genesis. While I can calculate the cosine of the viewing angle, it is not clear that such was done in Peter's figure 3 model. Or rather, that viewing angle may have been calibrated out before plotting. I at the moment assume therefore that we are viewing it axially straight on and maximum projected area of heating.
Note that from our 'poster' page graph, 1400 counts corresponds to V=8.5 for an M star, which should correspond well to the spectral distribution of the capsule, which has a peak temperature of 3600K and is no doubt cooler still at the times we observe; peak in the IR just like the star and the video camera.
In pondering how to scale the Genesis flux to estimate a prediction for Hayabusa, there is not only the differing KE at entry, but also that at the same altitude, Genesis has had a longer path length in the atmosphere and therefore has likely slowed more. Genesis entered at 8.0 deg angle vs 12.0 deg for Hayabusa and so Hayabusa has only 0.67 of the atmospheric path length, to a given altitude, as Genesis.
The preliminary Word .doc file for the photometry section of the JRS paper.
