This was a high probability event - the rank was high and the center of the path went right over Santa Cruz. It was also nicely positioned in time, before midnight. Tried to interest Viktoria in joining me, but her piano practice was higher priority, and the rest of the RCASS group didn't respond either. So, I drove to the observatory and packed up the 10" LX200 classic, and my occultation box, and eyed the low fog covering the county. I guessed it would be clear at higher elevations so I drove up towards UCSC and climbed above the fog level at about the 800 ft elevation level. I continued on to the Gray Whale Ranch crossing at the upper meadow. Setup and locating the faint star/asteroid combo went smoothly, and replacing the eyepiece with the PC164CEX-2 got me the star on the ZR45mc camcorder LCD screen without much trouble. The altitude was only 19 degrees, low in the east, over the lights of Santa Cruz and with full moon not far away. So, noise was a worry. The predicted magnitude drop was only 0.44 and I wasn't sure I'd see that visually. However, the event lasted 14 seconds and the drop was pretty easy to see. I was confident we had the event without having to review the tape. I've analyzed now, using Windows Moviemaker to interface with the camcorder, then Virtual Dub to make an .avi file suitable for Limovie, then to produce a .csv file suitable for Occular 4 to analyze. The screen shots of the results are below
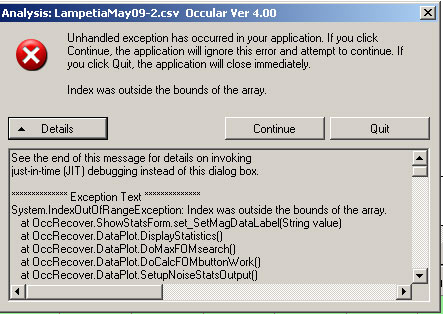
I also attempted to re-do Limovie using a smaller red circle of radius 4 in hopes of getting a better S/N. In fact, the drop did look better defined. However, when I attempted in Occular to do "final report", it went through the iterations and then came back with the error box shown below. In this case, the "final report" was blank. This happened also on the analysis shown above too, on some attempts. I don't know what it means.

The D was at 6:40:47.429 and the R at 6:41:01.874 with this smaller red circle analysis, which differs by a few tenth's of a second from the report with the larger radius=6 circle. Using 100 iterations instead of 60 seemed to allow a final report. The resulting report and plots are below, and the IOTA excel report is here.
|
...and the plot does seem to have a bit higher signal/noise ratio. |
Our data fits well with a spherical asteroid solution, from the IOTA profiles page |
Very cool to be able to use a telescope and a few hundred dollars worth of video equipment during an evening, and some excellent free-ware written by talented amateur astronomers to be able to measure the accurate shapes and sizes of asteroids!