The Occultation of an G=R=8.84 Star by Jupiter's moon Callisto
Jan 14/15, 2024 about 11pm according to C2A.
This event is a high value event as we have not had satellite spacecraft at Callisto for many years now, and the new IceyMoons Mission wants updated orbits for the moons. Occultations are the best way to do this.
OW cloud page
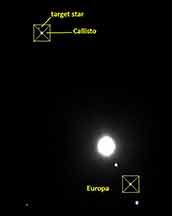
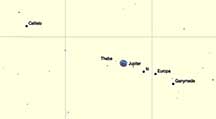
Could the Big Scopes on Hawaii, CA possibly see evidence of an atmosphere? Not our 8SE's I believe, not for a drop of only 0.08 mags. Pluto's extremely thin atmosphere caused obvious and clear gradual D and R events in 2019 from the 30" at Fremont Peak for Kirk and I. And the Titan occultation of a similar brightness star showed complex refraction spikes even for our 8SE scopes. However, the depth of the event is a challenge at 0.08 magnitude. The best S/N strategy appears to me, to be to strongly lower the gain, and also just a bit of defocusing. I will plan to experiment with different gain settings during the dark hours before the event with different gain settings, and then see which give no red pixels in PyMovie. We can get all 4 Jupiter moons in on the Watec chip on the 8SE scopes, but getting a comparison "moon" on the MIRA 36" will be impossible since Callisto is so far from the other moons, and opposite side from Jupiter itself. As of Jan 14, a call to Dan at MIRA found they do not yet have the gear, nor the weather...The weather looks terrible.
Below from Ted Swift in email 10/26/23 (links don't work, though)
This thread was years before the development of PyMovie and PyOTE, and they were using Occular, but the same principles out to apply.
* The long duration is in our favor. If you look at the path map, below, and the web site https://lesia.obspm.fr/lucky-star/predictions.php gives a key to interpreting it, the blue dots are one-minute increments. So at our ~ Bay Area latitude, a chord across Callisto will last a few minutes (about 8.2 minutes, or ~491 seconds, across the diameter in S. Mexico, and Hawaii). We’ll be looking for a consistent 0.1 mag change over many data points. The event (If this path prediction is accurate; it’s dated 2023-05-16) will be several minutes around the Bay Area. Chris Anderson in Twin Falls ID (Hi, Chris!) will be well placed to provide a valuable north edge.
* The brightness will also help with our signal to noise ratio. The event is magG ~8.8, which means we won’t be down in our camera’s noise. We should rehearse and figure out camera settings that keep our cameras out of saturation.
0.1 mag won’t be easy, but it’s do-able.
-Ted
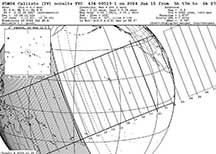
I measure that Santa Cruz is 75% of the way from the centerline to the northern limit on the sky plane. If so, our duration is 60% of maximum. That's 60% of 491 seconds.. |
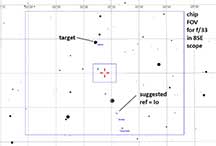
You can choose a reference star after the recording, but best to include all 4 Jupiter moons. Don't count on any stars; they're far too faint to work. But, Callisto is only mag 6.2 (5.7?), Io is the smallest and likely the faintest moon and so least likely to suffer saturated pixels, but also closest to Jupiter. If you take test video, you should make sure that both Callisto and your chosen reference moon are both unsaturated. |
The target is brighter in the R band, the standard magnitude drop using 6.2 and 8.8 is 0.08 mag (but OWc gives 5.7 mag for Callisto; but is that for opposition? It would be dimmer now, well past opposition, so perhaps 0.08 mag is correct? |
|
|
If our duration is 60% of maximum that's 491s x 0.6 = 295s, and half of that is 147s = 2min 27s; so add and subtract that from 6:20:51 UT to get our expected D and R times.
As of Jan 14:
The LuckyStar site only gives the Geocentric time of the occultation, which should not be used. This event eventually DID show up on my OW feed, and I recorded a station. From our near-northern limit site, I took the OW offset of my site and for a spherical Callisto, calculated the D and R times from the central time:
D 6:18:24 UT, so I'd recommend starting recording 2 min earlier or 6:16:24 UT
R 6:23:18 UT , so I'd recommend ending recording 2 min later or 6:25:18 UT
That's 9 total minutes of recording. It'll be a big file. Several GB. With probably drifting clouds, it's perhaps unlikely we'll have clean skies during that entire interval. Making calibration at the milli-magnitude level very tough. "Mission Impossible"? Good luck, Jim!
Results:
Partly cloudy skies slowly turned to mostly clear skies and I got a recording from the base of the driveway. Gain=11, setting=2x, sharpness=4, Gamma=1. Analysis to follow.
Richard Nolthenius
I observed from the base of my driveway, in what looked like clear skies, although I could see some clouds in the northeast, opposite the SW where Jupiter was. However, Jupiter's direction was towards the ocean, not a lot of city lights between me and the coast a mile or so away, and so there was not a lot of city light to show off any clouds. As it turned out, the cirrus that plagued the daytime and early twilight was still there, and affected this difficult event.
I first tested extensively to find what Gain setting would permit no saturation for either Callisto or Europa as the chosen comparison "star". That Gain was low; 11. 2x integration setting, sharpness=4 (standard) and Gamma=1 as always. My standard equipment now, for the past few months, is the Dave Gault gifted ZR85 PAL camcorder, and new Watec 910hx PAL version, bought last year, new.
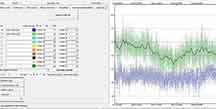
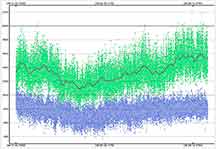
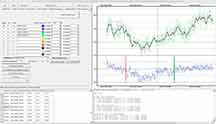
The first of images below is my first attempt; I did a Fourier finder, then did a PyMovie run, with TME apertures for both Europa and Callisto. There was a brief moment when the monitor showing the incoming video, flashed "NoPPS", which I interpret as a loss of time signal from the satellites. However, the time attached to the red-flagged frame was normal and so I left it alone; it was after the event was expected to end, by about a minute.
My opinion is that the TME method works best for faint target not far above "sky" in brightness. However the tight apertures TME chooses look to me to clip the dispersed light of the target, perhaps especially if cirrus scattering happens as well, and so for very bright objects in a very dark skies, and with a small drop, then TME is probably not the proper choice, leaving unnecessary noise due to clipped light from the target. So, I did another analysis, using 'static fixed' large enough aperture to be sure to get all of the target light. Seen below
Static Fixed Aperture PyMovie Run...
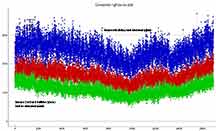 |

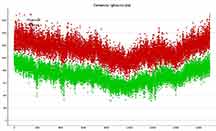
Europsa light curve, raw from PyMovie |

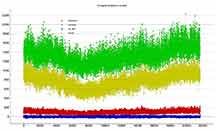
Callisto light curve, raw from PyMovie. I don't see the point to point scatter is any smaller here than for the TME aperture, at least to my eye. |
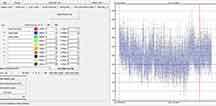
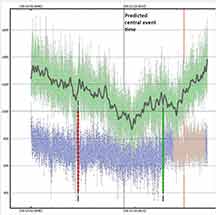
Final Callisto light curve. Still noisy enough to hide a detectable .04 mag drop. Europa was not included on the plot, to aid looking more carefully for the occultation. |
|
Kirk Bender
Also used Gain=11 on his NTSC Watec 910hx camera, from home a couple of miles away. Got very similar light curves
Kirk then did a 1s block integration and gave a very wide range of event durations; 1 to 500s and asked PyOTE to find the best solution. It ended up with a duration very similar to my own from a mile or so away; 328 seconds. However, his event is offset from mine by fully 34s earlier, and 47s earlier than the predicted D. I believe this may be because of the 3s additional block integration. His data was at 2x and Gain=11 on his Watec 910hx. His cloud pattern would be different than mine, is also true. Anyway, here's his tentative solution.
Block integration in pyote of 1 second (30 points).
Normalization on the tracking aperture, Europa.
I tried various x offsets on europa ; 0, 3, 5, 10. The D varied somewhat, but the R was always the same, the curve on the last part of the graph is flatter.
I did not choose a D and R manually, but gave it a minimum event of 10, max event of 500.
Here's the timing for offset of 3:
magDrop report: percentDrop: 11.5 magDrop: 0.133 +/- 0.005 (0.95 ci)
DNR: 4.60
D time: [06:17:19.8992]
D: 0.6800 containment intervals: {+/- 0.2702} seconds
D: 0.9500 containment intervals: {+/- 0.6976} seconds
D: 0.9973 containment intervals: {+/- 3.1047} seconds
R time: [06:22:47.6440]
R: 0.6800 containment intervals: {+/- 0.2702} seconds
R: 0.9500 containment intervals: {+/- 0.6976} seconds
R: 0.9973 containment intervals: {+/- 3.1047} seconds
Duration (R - D): 327.7448 seconds
Duration: 0.6800 containment intervals: {+/- 0.4157} seconds
Duration: 0.9500 containment intervals: {+/- 1.0226} seconds
Duration: 0.9973 containment intervals: {+/- 4.2896} seconds
These two analyses were preliminary. Now the analyses which became the reported analyses, are below
Re-analysis and thoughts from Tony George
Tony George in the Phoenix area submitted a 329s occultation from his own data, says his observation report summary on OW. However, he should have gotten a 390s event according to predictions.
He suggests using the x-offset to try to find a resonance with the cloud bumps in the light curve of Europa, and also suggests a 1-second block integration to help smooth more. I suspect that even a longer block integration might be necessary to deal with the clear bumps in the light curves of Kirk and I on the small time scale. There's bigger oscillations with a roughly ~30s period , but also sharper oscillations in the ~3sec period area, as I judge our light curves.
The OW path shows an uncertainty in the path of essentially zero. The red 1-sigma line is so close to the blue path edge line that they are on top of each other. This will allow a good calculation of the predicted D and R times to compare our analyses of noisy data. My careful measurements of the "observer line" below the OWdesktop map gives the distance from the centerline of each observer site.
Calculated D and R times for Tony George's OW chord, and for the Nolthenius/Bender chord
* Note, Kirk and I were less than a mile separated in the cross-track direction, Kirk west (earlier) than me.
Using the tick marks on the OW desktop allows a pretty accurate measurement of the sky plane separation of our chords from the centerline. For a very spherical moon like Callisto, I can straight-forward geometry pretty accurate D and R predicted times. The distance from the centerline to the edge of the path on OW desktop was 24.22 ticks.
Tony George: 14.7 / 24.22 = .6069 = fraction of the path width. Pythagorus then gives .795 x 8.2 minutes for his expected duration = 6.52 min = 391 sec.
Kirk and I: 18.37/24.22 = .758 = fraction of the path width. Pythagorus then gives 0.652 x 8.2 minutes max duration for Santa Cruz, = 5.345 minutes = 321 sec. Therefore:
my Santa Cruz predicted D = 6;20:51 - 2:41 = 6:18:10 UT
my Santa Cruz predicted R = 6:20:51 + 2:41 = 6:23:32 UT
David Dunham's predictions give D and R times for many cities, including Santa Cruz, and so is probably the better choice to use.The duration from Dunham's data is 330s = 5min 30s, very close to my observed 5min 29s
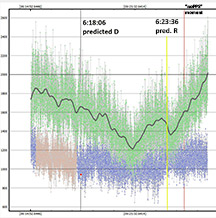
Dunham list Santa Cruz predicted D = 6:18:06 - this is 12s later than my PyOTE determined D
Dunham list Santa Cruz predicted R= 6:23:36
- this is 13s later than my PyOTE determined R below.
However, the Dunham listed long/lat for Santa Cruz is 3 mi west of me and 3 mi south of me, which is in the correct direction to make my timings a little earlier and duration a little shorter than the Dunham list prediction. By how much? Well, it looks like the occultation took about 1 minute to go from Santa Cruz to central Arizona, so that's 10 degrees of longitude or 60s/600' or a speed of 1sec per 10' of longitude, or 0.3s offset roughly, from Dunham's Santa Cruz position to mine. That's negligible.
Richard Nolthenius
PyOTE Runs
1. First, my PyOTE reduction using the "Static Aperture (SA)" run from PyMovie, using a 1-sec block integration (25 points per block for PAL), and a smoothing on Europa's light curve till it looks about right, and X offset till metric minimized.
PyOTE Log file
magDrop report: percentDrop: 7.4%, magDrop= 0.084 +/- 0.005 (0.95 ci)
DNR: 2.52
D time: [06:17:54.0831]
D: 0.6800 containment intervals: {+/- 0.5967} seconds
D: 0.9500 containment intervals: {+/- 6.4540} seconds
D: 0.9973 containment intervals: {+/- 17.1330} seconds
R time: [06:23:22.7206]
R: 0.6800 containment intervals: {+/- 0.5967} seconds
R: 0.9500 containment intervals: {+/- 6.4540} seconds
R: 0.9973 containment intervals: {+/- 17.1330} seconds
Duration (R - D): 328.6375 seconds = 5min 29s, this is only 1s shorter than the predicted duration.
This is well within the 2-sigma 9.3 s confidence limit. However, my mid point is 13s earlier than prediction.
Duration: 0.6800 containment intervals: {+/- 1.3939} seconds
Duration: 0.9500 containment intervals: {+/- 9.3009} seconds
Duration: 0.9973 containment intervals: {+/- 18.9762} seconds

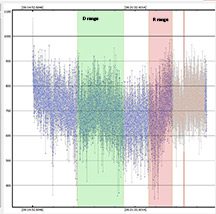
PyOTE solution after adjusting the x-offset from Europa to Callisto, of 5 seconds due to slow cloud drifting, and choosing the D and R intervals manually. Likely true drift was shorter than 5s and so I will do another analysis soon... |
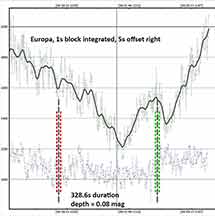
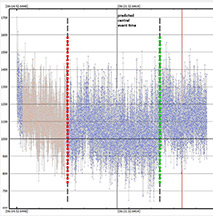
High, very thin cirrus wandered through during the 11 minutes of recording, as seen in the Europa light curve, and corrected by the smoothing interval of 12s (black curve). |
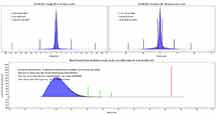
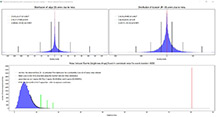
Remarkably, PyOTE finds the drop of 329 seconds or 5.48 min to comfortably pass the false positive test, with a magnitude drop which is exactly what was predicted based on a 6.2 mag Callisto and 8.8 magnitude target star; drop of 0.084 magnitudes. |
|
|
2. Same PyMovie Static Aperture; but Pyote Run #2 and did not do an artificial added block integration
Here's a second run (on Jan 21) on the SA aperture PyMovie run. This time, I did not add a 1-sec block integration, but left it at the raw block integration (2x = 1 frame). I carefully set the metric interval (in orange) to be before the D, and then ramped up the smoothing interval for Europa until a minimum metric scatter was reached, which happened at smoothing=346. I then used the "X offset" and bumped that upward one value at a time until the metric figure was further minimized. That happened at X=46 = 46/25fps = 1.84 seconds offset over 4' of separation between Callisto and Europa. Thatt speed is about 26 s to cross the diameter of our own moon. From my watchings of cirrus clouds at only 36 deg above the horizon, going across the moon, that seems quite reasonable. I set rather wide D and R range intervals to test, believing the true D and R must be somewhere in these ranges, by eye and by prediction. The wide ranges and no added block sizing meant over 3 million D/R intervals to evalute, which took about 15 minutes on my Dell laptop to do. The result was almost exactly the same as the earlier blocked analysis which started with a narrow D and R range and 1 sec block integration. I also tried "find event" only giving it a range of event duration min/max, but that did not give a status bar and after wating some minutes with no response, (did it freeze?), I backed off and set the D and R ranges manually but generously, so as not to bias the result.
The solution passes the FP test quite well, no doubt because of the long 5 min duration of 25 data points per second. The duration and depth of the event is also essentially identical to the first analysis: 0.080 mag depth vs predicted 0.07 mag depth, and 328.877 sec vs Dunham's 330s prediction (but that prediction was only tabulated to 1 decimal point in minutes, or 6s precision, so it is a match.). So duration and depth match the OW predictions; however, the offset in the predicted central time remains at about 12s (+-6s?) early. I do not know if this is a disqualifier, i.e. out of possible range of what could be true, or not. I'm asking the question now in the IOTA message board.
magDrop report: percentDrop: 7.1 magDrop: 0.080 +/- 0.003 (0.95 ci)
DNR: 0.90
D time: [06:17:53.9231]
D: 0.6800 containment intervals: {+/- 0.4443} seconds
D: 0.9500 containment intervals: {+/- 1.7971} seconds
D: 0.9973 containment intervals: {+/- 4.2403} seconds
R time: [06:23:22.8006]
R: 0.6800 containment intervals: {+/- 0.4443} seconds
R: 0.9500 containment intervals: {+/- 1.7971} seconds
R: 0.9973 containment intervals: {+/- 4.2403} seconds
Duration (R - D): 328.8775 seconds
Duration: 0.6800 containment intervals: {+/- 0.8295} seconds
Duration: 0.9500 containment intervals: {+/- 2.5000} seconds
Duration: 0.9973 containment intervals: {+/- 5.1061} seconds
Of these analyses, I regard this, the second SA analysis as the most reliable of all runs.
I tried a 3rd analysis of the SA PyMovie output. This time doing a block integration of exactly 3 sec = 75 points. With far fewer points, the FP test is not as positive, but still passes. The D shifts quite a bit later however, inconsistent with the predicted D by almost 2 minutes. R is earlier, and duration is now only 195s, not the predicted 290s.
D time: [06:19:49.8022]
D: 0.6800 containment intervals: {+/- 1.4695} seconds
D: 0.9500 containment intervals: {+/- 4.7882} seconds
D: 0.9973 containment intervals: {+/- 11.9549} seconds
R time: [06:23:04.8007]
R: 0.6800 containment intervals: {+/- 1.4695} seconds
R: 0.9500 containment intervals: {+/- 4.7882} seconds
R: 0.9973 containment intervals: {+/- 11.9549} seconds
Duration (R - D): 194.9985 seconds
Duration: 0.6800 containment intervals: {+/- 2.4093} seconds
Duration: 0.9500 containment intervals: {+/- 6.7666} seconds
Duration: 0.9973 containment intervals: {+/- 14.9907} seconds
Analysis of the TME PyMovie output
I chose an entirely different metric range; this time after the expected R. Again, I adjusted the smoothing on the reference Europa until a minimum in the metric, at only 98 this time. then adjusted the X-axis offset until a new minimum, which happened at x-offset=22 or about 1 second. I will argue again that TME apertures are not appaently the optimum for this situation of very bright targets and very dark skies. Too much of the wings of the target light are missing and perhaps even ending up in the "sky" annulus. Nevertheless, the solution is very similar. Mag drop rose a bit to .095, duration dropped a bit more than 1s; D a bit later, R a bit earlier by fractions of a second.
magDrop report: percentDrop: 8.4 magDrop: 0.095 +/- 0.003 (0.95 ci)
DNR: 1.12
D time: [06:17:54.4031]
D: 0.6800 containment intervals: {+/- 0.3016} seconds
D: 0.9500 containment intervals: {+/- 1.3058} seconds
D: 0.9973 containment intervals: {+/- 3.0903} seconds
R time: [06:23:21.9606]
R: 0.6800 containment intervals: {+/- 0.3016} seconds
R: 0.9500 containment intervals: {+/- 1.3058} seconds
R: 0.9973 containment intervals: {+/- 3.0903} seconds
Duration (R - D): 327.5575 seconds
Duration: 0.6800 containment intervals: {+/- 0.5842} seconds
Duration: 0.9500 containment intervals: {+/- 1.8145} seconds
Duration: 0.9973 containment intervals: {+/- 3.5781} seconds
Of these analyses, I regard the second SA analysis as the most reliable of the 3. How does this compare to the best available predictions? I got a response from John Irwin who runs predictions directly from the ephemerides, and he considers this more reliable than the planetary satellite occultation predictions he's seen from OCCULT.
Here are my predicted topocentric timings in UTC using DE440/JUP365 and
a Callisto radius (from IAU) of 2410.3 km:
RN: -122.032142°, +36.973181°, -25 m
D = 06:17:55.2, R = 06:23:20.6, Dur = 325 s.
KB: -122.051297°, +36.963442°, +4 m
D = 06:17:54.9, R = 06:23:20.7, Dur = 326 s.
Thus, not much difference between you and Kirk.
Here are the O-C values in seconds:
RN: dD = -1.2, dR = +2.2
KB: dD = -29, dR= -33
where I used Richard's considered most reliable results (#2).
I also note that the disappearance occurred on the dark limb of Callisto
which might produce a cleaner event in your light curves, but that may
not even be detectable in what you have recorded. However Richard's O-C
is a little better for the disappearance than the reappearance, so there
may be something in that. (RN: I don't see why this should matter; the spatial resolution of the equipment was not at all able to see the star separate from the Callisto at the D and R, and as long as there were no saturated pixels, where the dark limb was should not affect results)
For reference, the attached image shows the apparent view of Callisto
and the star about ten seconds before disappearance. The phase angle is
about 11° which brings into view a thin strip of the dark side of the
satellite.
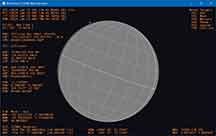 |
Kirk Bender
Kirk observed from home, about 1.3 miles west of my location and less than a mile cross track south of me, where his event should have been a little shorter but only by a small fraction of a second. He too used an 8SE scope with Watec 910hx EIA, at Gain=11 as I did, and other parameters of Watec set identically. Past experience is that his camera is a good low-noise camera. Here's his description
I made an analysis with no block integration, did not set smoothing metric intervals, minimized the smoothing metric for offset of 0, then changed the x offset to minimize the metric further.
I gave it a min and max event size of 2 to 9 minutes, or 3600 to 16200 points.
I left it running all night, it chose the D and R with these timings:
magDrop report: percentDrop: 11.6 magDrop: 0.133 +/- 0.003 (0.95 ci)
DNR: 1.21
D time: [06:17:25.9942]
D: 0.6800 containment intervals: {+/- 0.0889} seconds
D: 0.9500 containment intervals: {+/- 0.3361} seconds
D: 0.9973 containment intervals: {+/- 0.8361} seconds
R time: [06:22:47.6440]
R: 0.6800 containment intervals: {+/- 0.0889} seconds
R: 0.9500 containment intervals: {+/- 0.3361} seconds
R: 0.9973 containment intervals: {+/- 0.8361} seconds
Duration (R - D): 321.6498 seconds
Duration: 0.6800 containment intervals: {+/- 0.1581} seconds
Duration: 0.9500 containment intervals: {+/- 0.4627} seconds
Duration: 0.9973 containment intervals: {+/- 1.0232} seconds
Today I made another run, no block integration, and I set the smoothing metric intervals outside the D and R from the previous run.
You can set multiple intervals by selecting two points, clicking the "mark metric points" button, then select another two points, then the button again.
I then minimized the smoothing metric as before with no offset then further with an offset.
This time I selected the D and R manually, based on the previous run, with wide widths.
I then let it find the event, after 45 min. it gave these timings:
magDrop report: percentDrop: 11.5 magDrop: 0.132 +/- 0.003 (0.95 ci)
DNR: 1.20
D time: [06:17:26.0609]
D: 0.6800 containment intervals: {+/- 0.0901} seconds
D: 0.9500 containment intervals: {+/- 0.3416} seconds
D: 0.9973 containment intervals: {+/- 0.8369} seconds
R time: [06:22:47.6440]
R: 0.6800 containment intervals: {+/- 0.0901} seconds
R: 0.9500 containment intervals: {+/- 0.3416} seconds
R: 0.9973 containment intervals: {+/- 0.8369} seconds
Duration (R - D): 321.5831 seconds
Duration: 0.6800 containment intervals: {+/- 0.1629} seconds
Duration: 0.9500 containment intervals: {+/- 0.4735} seconds
Duration: 0.9973 containment intervals: {+/- 1.0408} seconds
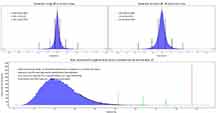
The containment intervals are small, and it greatly passed the false positive test.
This is very close to the previous run, so for simplicity I think I'll just submit the previous results, without the separate smoothing metric intervals.
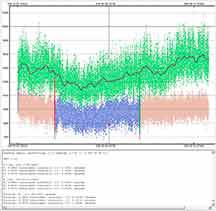
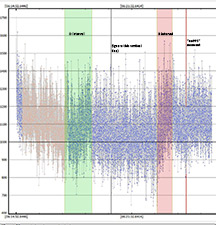
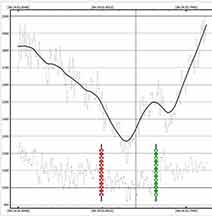
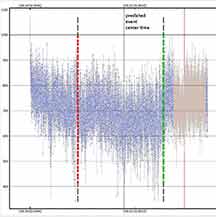
The metric interval here was two intervals; before, and after, the occultation. Gave essentially identical results as using the entire Callisto light curve as the metric interval. |
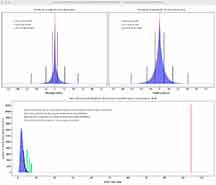
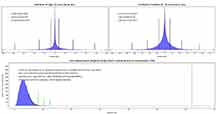
Strongly passes the False Positive test. The duration was 321.5s, not that different than the 326s predicted, but it was fully 33s early, which seems unlikely to be correct. |
|
|
|


