Occultation by the Asteroid Peter
Jan 11/12, 2014
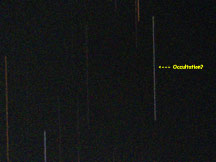
This was a nice bright event, magnitude 10.1, of a blue star in Aries, setting in the west, about 39 degrees from the waxing gibbous moon. But the rank was low; 28, and the path was predicted to cross Pt. Reyes and not Santa Cruz; we were south of the southern 1-sigma line. I observed by taking a star trail using the 12" Meade f/6.3 on G11 mount with the SBIG ST2000xcm CCD camera.
At Cabrillo, the predicted event time was 7:00:52 UT, at track 118 km south, and odds of an occultation at only 4%. Derek was at 102 km south and might also have an event. There was a bank of clouds a half hour before the event which covered most of the sky and migrated east, and might possibly have been trouble for Morgan Hill?

Cabrillo College Observatory is at the red "x" south of the path (not the fat fuzzy red one above)
|

The predicted occultation moment was in the center of this 50 second star trail, and indeed there does seem to be a "divot" taken out of the middle of this trail, of roughly a second duration. This is a 72pix/inch jpg, not ideal for timing analysis.
The predicted time of the occultation was 7:00:52 UT for Cabrillo College |

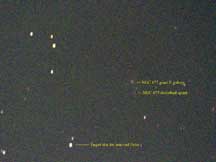
An interesting galaxy pair NGC 677/675 (but apparently not interesting enough to deserve a journal paper; I've looked) near the target star. They're the brightest members of a galaxy cluster better seen here. Mine here is a pretty crummy photo with the scene now less than 20 degrees up, with the sky brightened by Santa Cruz 7 miles away, and the 89% moon about 40 degrees away. A quick 1-minute 'grab' unguided. |

Here is a minimally compressed .jpg, rotated and cropped, at 72 pixels/inch. The original .tif, also cropped, is here. Here's the original uncropped .tif file. The images were adjusted in Photoshop only with the 'levels' command to improve contrast. The trail starts at left at 7:00:18.19 UT +- 0.16 sec. The gap is thus about 10 seconds or 4 diameters early, and also about 3 diameters south of prediction. |

The center part of the image, click to see it at large size to give good pixel-level resolution.
|

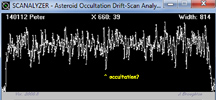
Jan 17: John B ran another Scanalyzer analysis on the Peter event. Procedure: rotate image so it's exactly horizontal, set how many pixels to integrate vertically (i.e. width of star trail), making as tight as possible to eliminate outside noise, and output levels along the trail. It looks like about 1 original CCD pixel per light curve point. |

John Broughton in Australia did his analysis after processing the .tif version of the image above (see right). His comment was that Scanalyzer does not work well on events this short. |

This is John's monochromatic version of the image above. In his words the event looks "less convincing than in the original", which may be true, although it appears to me that many of the pixels on this image are saturated, dropping the contrast between the D-R gap and the unocculted image. This was the image used to produce the Scanalyzer light curve at left.
|
|
Note that the star was blue, meaning hot, meaning it was almost certainly a main sequence star and not a supergiant - and it must be quite distant to be 11th magnitude. This means the angular size was quite small and this would be favorable for producing a diffraction fringe rise in brightness at ingress and at egress - which indeed may explain the bright pixels bracketing the event. Was there really an occultation? My opinion is 'yes... probably'. Note that the star trail thickness due to seeing and tracking, is the same width as the size of the occultation gap, so we should expect that a ~100% occultation would look more like a ~1/2 drop, which it does. Using the crosshairs function in CCDOPS, gives a length of 770 pixels = 50 seconds. The "D" was at pixel 494, the R at pixel 504, and the end at pixel 889, giving 0.0649350 seconds per pixel and giving timings of...
D: 7:00:42.54
R: 7:00:43.19
The times correspond to the pixels where the brightness drop is steep. The accuracy on the gap is about a pixel or two, or 0.09 sec, and the absolute time about 0.2 second. The event, if real, is 4 diameters early and 3 diameters south of the prediction. But are they real? The saga continues with efforts by Joe Garlitz and Tony George, and also Scott Degenhardt....
Jan 18
Joe Garlitz and Tony George also tried their hand at drift scan analysis of this troublesome record. After man-hours of effort, the verdict is - liklihood that the dip is noise is just too high. It LOOKS real-ish by eye, but the light curves from all variants of the image do not look like a real event, but just a momentary bigger oscillation in bright-faint-bright. So, not convincingly a miss, and not convincingly an occultation... we know about the same as before I ever opened the dome.


