Brisbane, Australia Conference on Hypersonics -Notes, Material for Kitting, Nolthenius etal Publications
All images below are with the PC164C video camera with manual gain set to maximum sensitivity, mated with Nikon 50mm f/1.8 lens, and with Peter Jenniskens' 600 lines/mm objective grating. Image scale: 110 nm for the width of the video frame. Stacking of some images was done in Registax 5 software on AVI files were 2-3 seconds in length. MiniDV tape downloaded to Dell E1505 WinXP laptop using firewire, converted using VirtualDub software to uncompressed AVI format, then single or stacked frames extracted in Registax, saved as high quality JPEG's, and thumbnails here made in Photoshop. No other photoshop enhancements.

June 6, 2010 Spectrum of Venus on the red end. Altitude 11 degrees above the horizon, or 1.47 magnitudes of extinction here at sealevel, which then corresponds to a V magnitude at the zenith of -2.25 since Venus was then at V=-3.72. Single frame from my PC164C recording with Jenniskens 600line/mm objective grating, from Cabrillo College Observatory. Note the zero-th order image of a star at center top |

Same Venus spectrum, this time a 60 frame blind stack using Registax 5 software. Noise is considerably reduced. The deep atmospheric O I band at 777nm in absorption is on the left side of the frame and easy to resolve. Zeta Hydra (V=3.2, V-I=0.87, corresponding to zenith magnitude of V=4.5) is at center near top. Other bright spots are hot pixels. Zeta Hydrae is obvious because of its point spread. |

May 22, '10 at SETI Institute. Calibration images of first order emission line spectrum of (point) light source which was tuned to be the same total brightness as that expected of the Hayabusa capsule at maximum heating. PC164C with Nikon 50mm f/1.8 standard lens. 97 frames stack. |

90 frames stack Same calibration setup, 1/2 field width blueward of the image at left. Note the doublet at left center here is the same as that at right-center in the previous image. |
|
Photometry.
Photometry proved difficult, for several reasons. (1) The video camera has unknown gamma, (2) has a spectral sensitivity curve which differs widely from the standard Johnson/Cousins system, (3) the video input has been sent through an image intensifier which will have its own gamma, (4) the intensifier may have saturated while the video camera detector chip has not, or vice versa, (5) automatic gain control on the video camera set in within a few seconds of the 1-minute long re-entry, (6) strong vignetting together with tracking error added an additional variable to the absolute sensitivity vs time, (7) the best software available, to the author's knowledge, is Tangra, which does a good job of tracking a jerky video, but not perfect (8) the bus and capsule are quite close for the early part of the flight, making sky subtraction problematic, (9), the video system was assembled for sensitivity to faint object, for tracking, not for photometry - the bus contains an increasing fraction of saturated pixels beginning as early as frame 37, and the capsule by frame 172. Both objects have less than 1 second from the time of first appearance until saturation. For these reasons, the photometric curves of the first few seconds of re-entry of the bus and capsule are included here mainly for completeness. Time is local time, from the time stamp, counting frames from the local time=11:21:53->54 second change-over assuming 30 frames/sec.
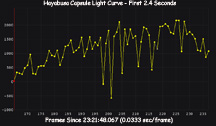
Capsule light curve using aperature photometry, beginning 1/3 sec after first detection at V~9 limit. Proximity to bus and faintness made for large variance. Drop outs are tracking jitter. Brightness drop after frame 228 due to auto-gain from rapidly brightening nearby bus. |

Light curves of three unsaturated comparison stars during the first 3 seconds after re-entry detection. The spikes at the end are tracking loss. The RMS error is 0.38 magnitude (instrumental R band). The longer term variance is likely due to tracking error + vignetting, as well as auto-gain changes. |

Bus light curve using PSF photometry. Widespread pixel saturation after frame ~80 prevents good solution. Tracking jitter at frame ~90. Significant auto-gain change after frame ~220. Bus first detected at V~9 1.15 sec before light curve begins.
|
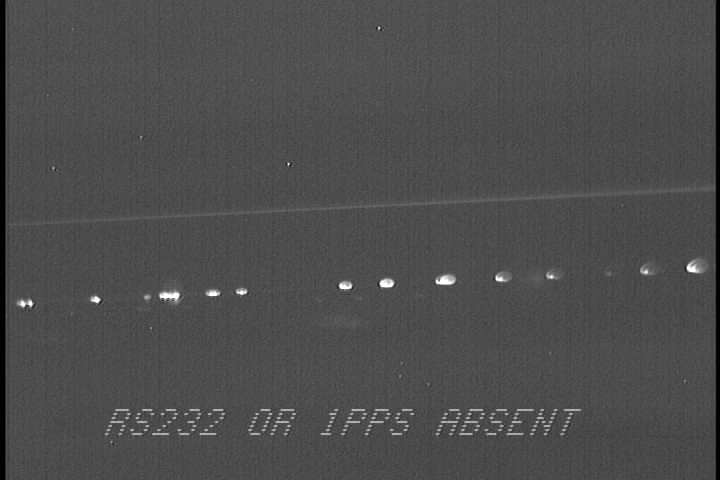
The main Hayabusa bus contains a growing number of saturated pixels after frame 37, and the capsule after frame 172. Saturated pixels are pegged at the maximum bit value, artificially lowering the actual frame to frame variance. The capsule first appears (slightly lower right of main bus) on the video at frame 156 (23:21:53.27 local time), and the main bus first appears on frame = negative13 (=23:21:47.63 local time) (as seen on Windows Movie Maker output AVI, before VirtualDub conversion to uncompressed format beginning at a point where reductions can begin (earlier, manual panning was severe)).
Photometry Settings: Tangra software. "Tracking Asteroid"/"Wind..."/"Strong Flickering" checked, set to aperature photometry with "average background" for sky subtraction method, for the three comparison stars and for capsule (PSF would not allow tracking on these fainter objects). PSF photometry with "background mode" background subtraction for main bus light curve.
One of the 3 target stars is the right side of a close pair, just above the spacecraft. It's average counts, with a couple of different aperature/sky circles, both come out to 1400 counts. It is SAO 99874, a V=8.5 class M star. Another star nearby is a 7.9 class G star, with avg counts of 1550. Therefore, 10,000 counts corresponds roughly to V=5.9 on the instrumental system, about where saturation begins for the bus.
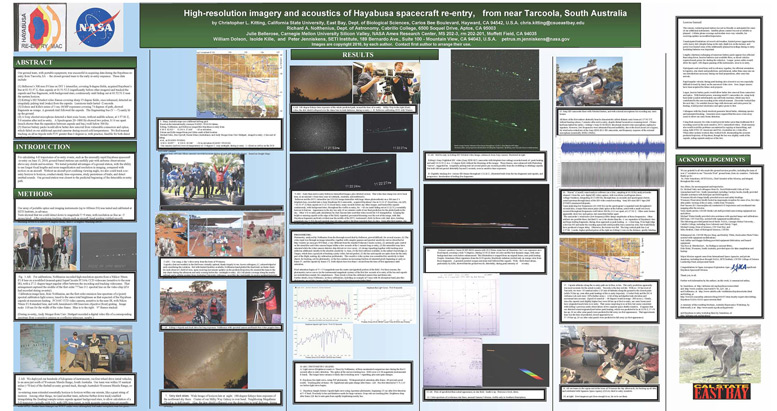
Our poster paper presented at the Workshop on Hypersonics in Australia, March 2011. Click on the poster for a larger version. A high resolution version will be linked sometime after publication issues are settled.
|
Modelling the light curve. information page
Dec 16, 2011 Notes
Tangra output file from Spring '11 reductions for the capsule is called
Julie's video file for Tangra reduction is called c:\camcorderAVI\julieVD.avi
For julieVD.avi, which starts later than the file given me by Chris, UT=1:51:48.03333 + .033333*F where F is frame number
Tangra test notes


